
Operational Intelligence
14. Analytics & Conversion Reporting
The Analytics engine aggregates pipeline performance, conversion rates, deal cycle duration, and rep activity without exporting data to external spreadsheet files.
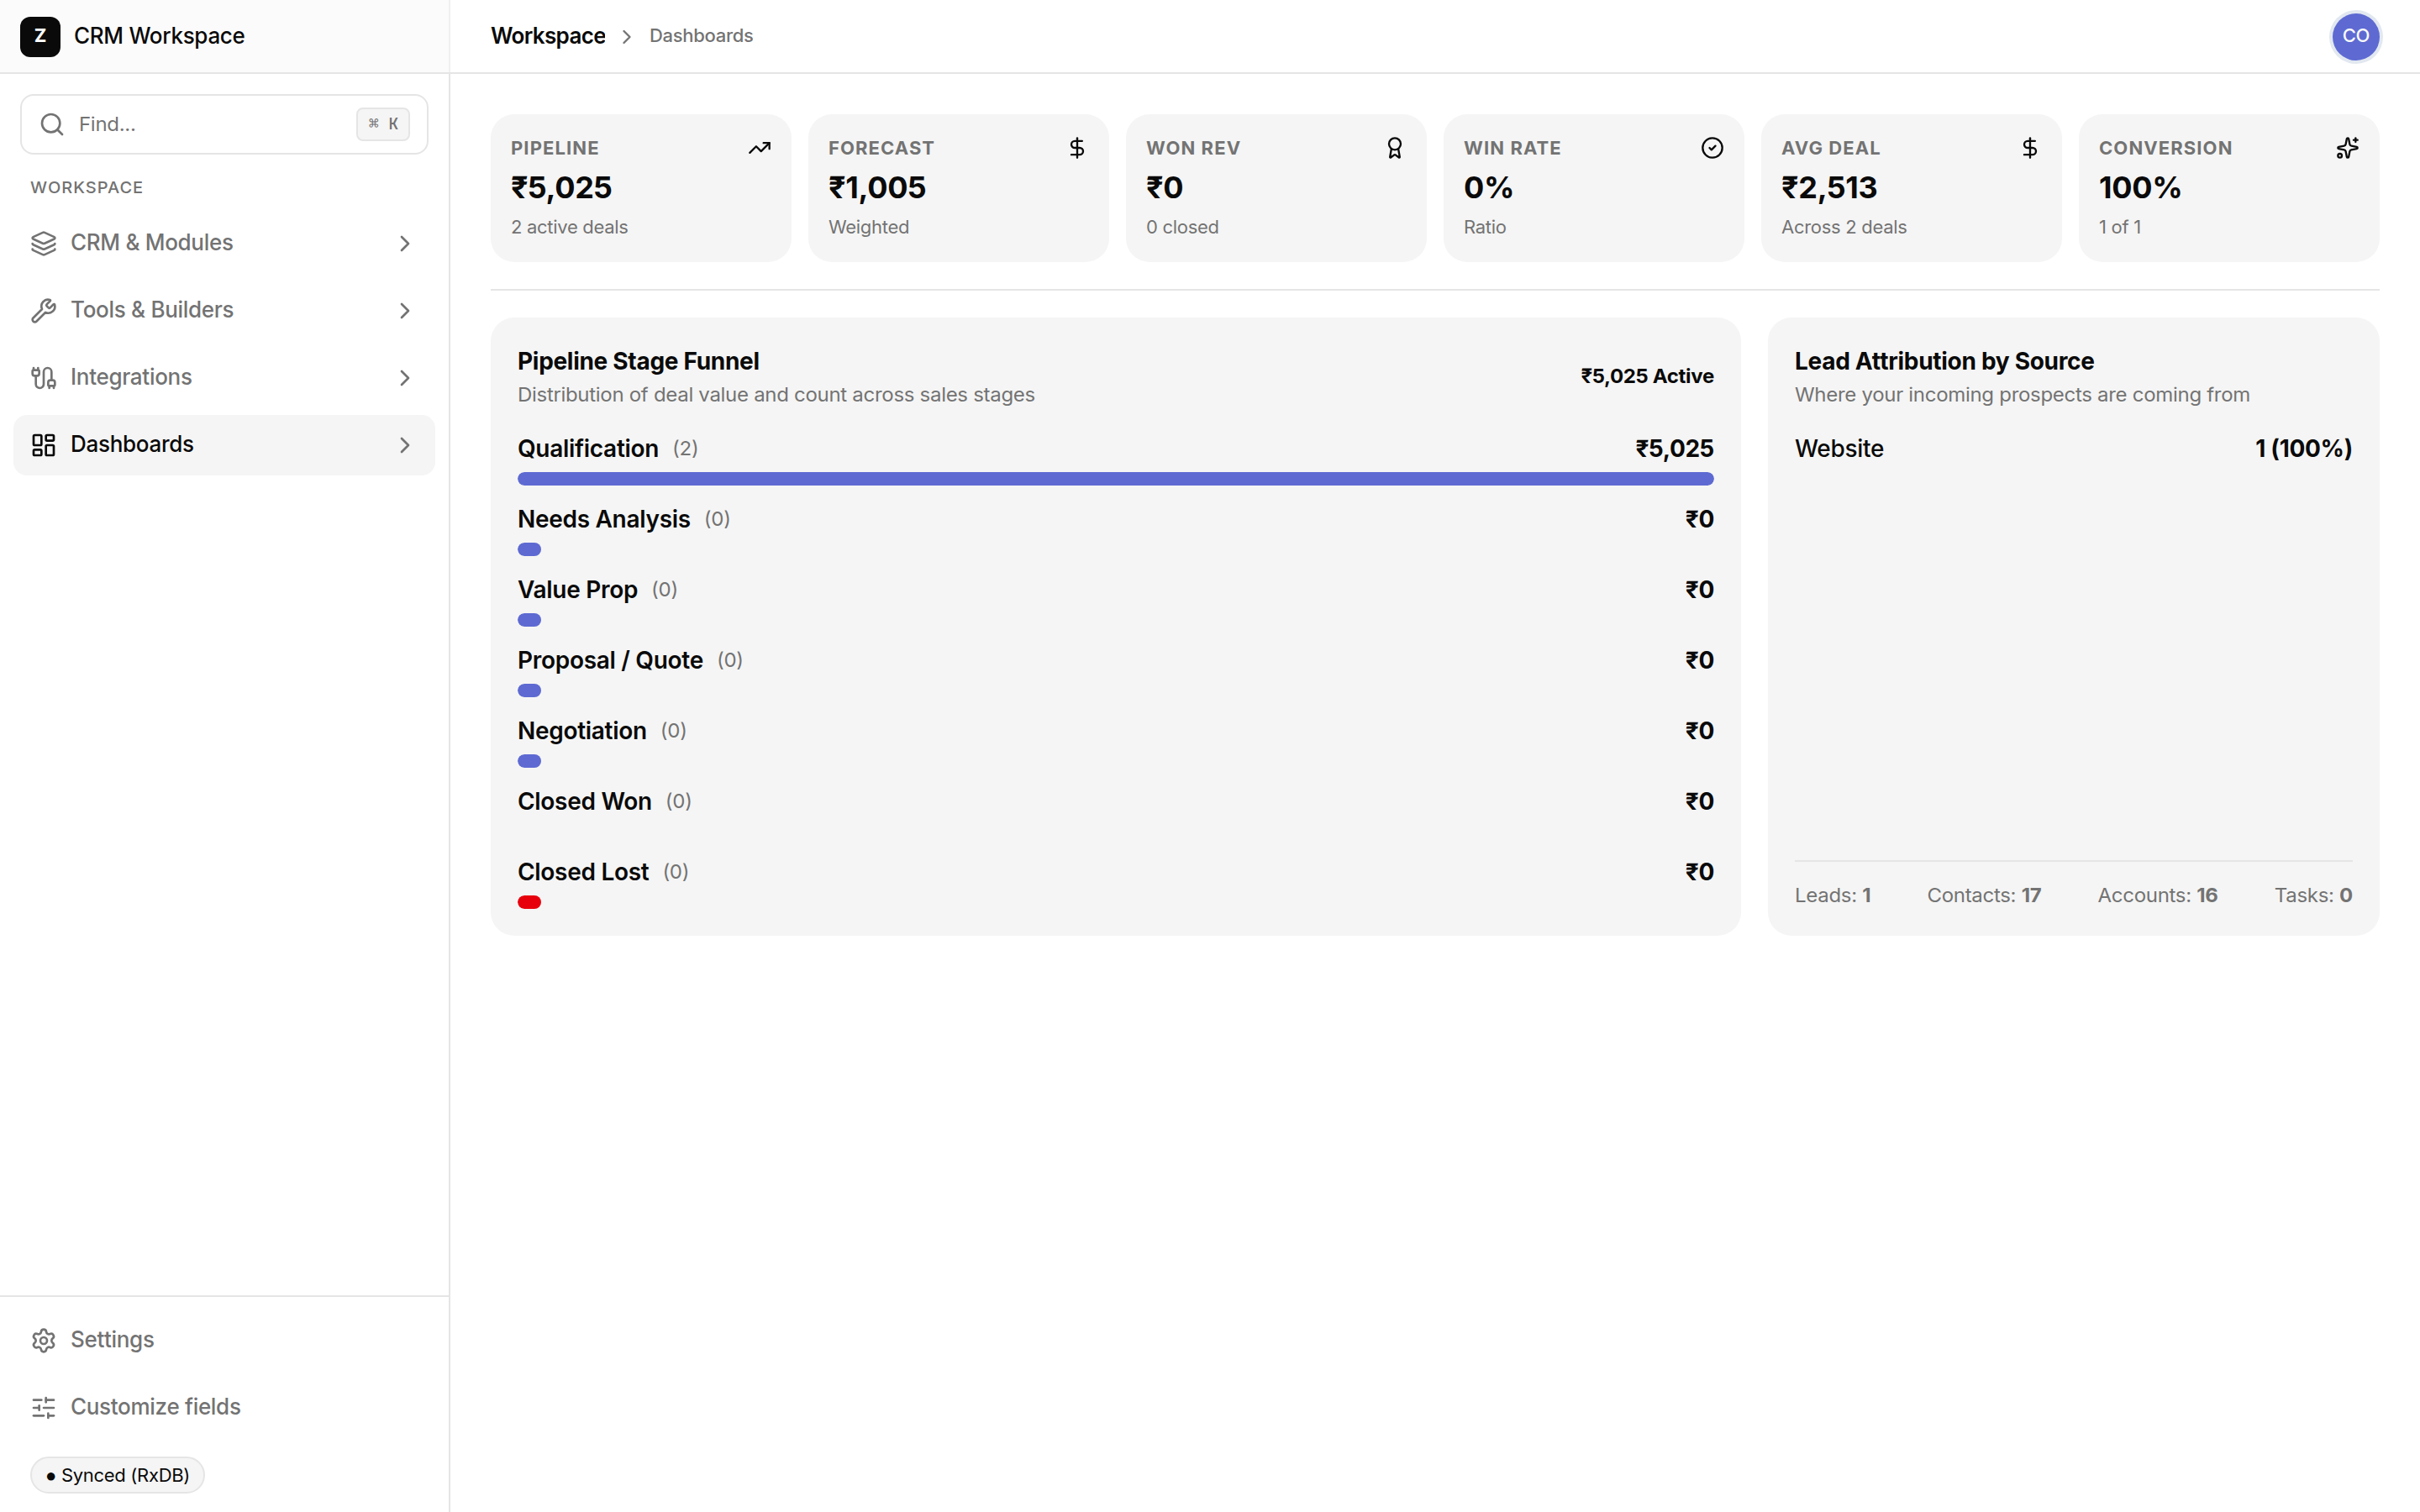
Core Operational Formulas
Standard business formulas computed automatically by the analytics engine:
| Metric Name | Formula / Computation | Operational Significance |
|---|---|---|
| Win Rate Ratio | (Won Deals / Total Closed Deals) × 100 | Measures sales qualification efficiency |
| Pipeline Velocity | (Deals × Win Rate × Avg Deal Value) / Cycle Days | Daily revenue generation speed across the pipeline |
| Days in Stage | Current Time - Stage Entry Timestamp | Identifies bottleneck stages where deals stall |
Analytics Alternatives Comparison
| Reporting Dimension | SHPI Native Analytics | Complex BI Platforms (PowerBI/Looker) | Manual Spreadsheet Pivot Tables |
|---|---|---|---|
| Setup Effort | Zero configuration; charts calculate live from your records | Requires dedicated data engineering, ETL pipelines, and schemas | Hours spent copy-pasting CSVs and rebuilding pivot tables |
| Data Freshness | Instant updates the moment a sales rep moves a deal card | Subject to hourly or daily data warehouse batch sync delays | Instantly outdated the minute the spreadsheet is exported |
| Actionability | Clicking an analytics bar drills directly into the matching deals | Static dashboard visualizations disconnected from underlying records | Must manually find matching records in another workbook |